Who emits the most Co2?A treemap animation with Plotly.graph\_object
Who emits the most Co2?A treemap animation with Plotly.graph_object Use Plotly Graph Object to make a treemap with a slider for changing data display.
Continue...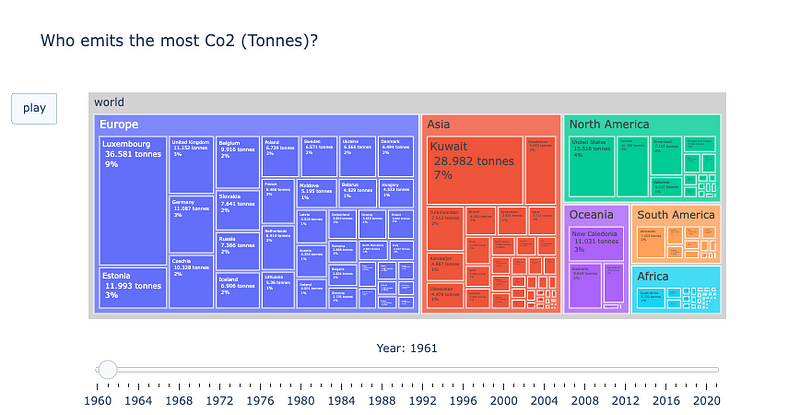
Who emits the most Co2?A treemap animation with Plotly.graph_object Use Plotly Graph Object to make a treemap with a slider for changing data display.
Continue...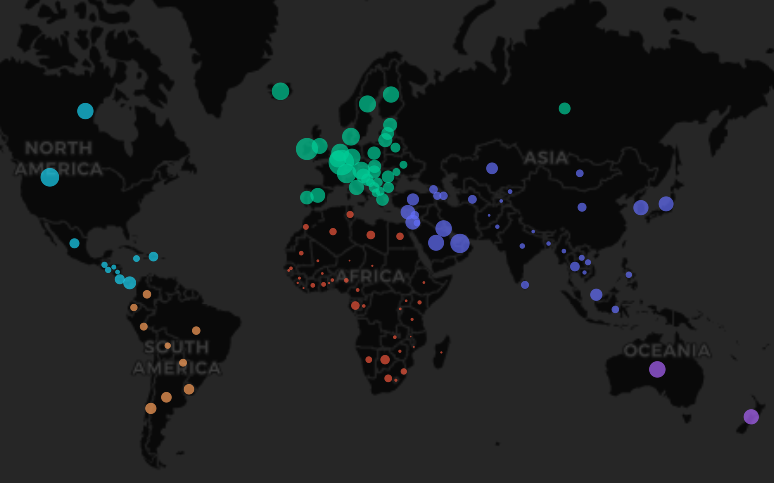
Simple yet stunning and meaningful geospatial visualization using Happiness and Confict data With Geopandas, Plotly Express and Folium
Continue...